1. ArchDaily
  2. Mapping

Mapping: The Latest Architecture and News

Choreographing Lagos: Dele Adeyemo on Dance, Cosmology, and Spatial Practices

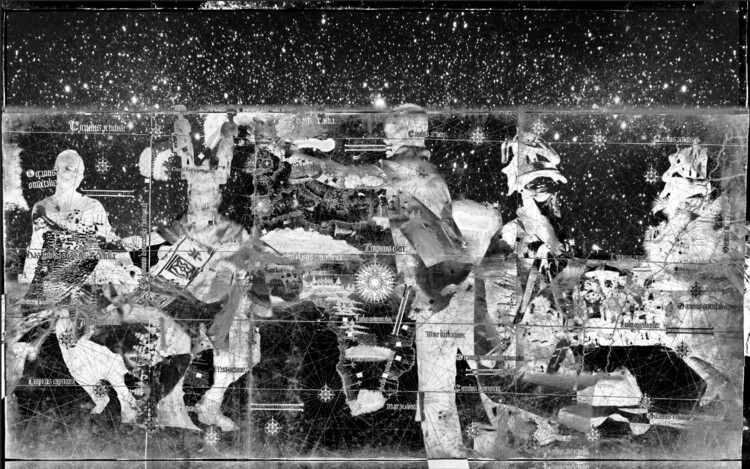
Having thrown a stone today, Eshu kills a bird of yesterday. The Yoruba proverb tells both a story of reparation and of ancestrality by joyfully bending spacetime conventions and accessing subjects from the past with present actions. The saying offers a poetic entry point to broader West African traditions and to the practice of Scottish-Nigerian artist and architect Dele Adeyemo. Named one of the winners of the ArchDaily 2025 Next Practices Awards, Adeyemo's work brings together ecology, spirituality, dance, and territory, examining how embodied cultural practices can generate alternative spatial possibilities within and against the architecture of racial capitalism.

Born in Nigeria and raised in the United Kingdom, Adeyemo has been visiting Lagos for many years. Through this engagement, he has developed an extensive body of research on collective movement practices that predate capitalism and offer distinct, often imaginative spatial intelligences operating alongside dominant systems. ArchDaily spoke with Dele about his artistic and pedagogical practices, and how he identifies design sophistication where architects often perceive deficiency.

Choreographing Lagos: Dele Adeyemo on Dance, Cosmology, and Spatial Practices - Image 1 of 4Choreographing Lagos: Dele Adeyemo on Dance, Cosmology, and Spatial Practices - Image 2 of 4Choreographing Lagos: Dele Adeyemo on Dance, Cosmology, and Spatial Practices - Image 3 of 4Choreographing Lagos: Dele Adeyemo on Dance, Cosmology, and Spatial Practices - Image 4 of 4Choreographing Lagos: Dele Adeyemo on Dance, Cosmology, and Spatial Practices - More Images+ 20

Mapping as Design: A Resource-Based Approach to Rural Design in the United States

In 1982, at a conference on earth building in Tucson, Arizona, an unusual presentation challenged everything architects thought they knew about rural resources. Instead of focusing on construction techniques, the presenter, architect Pliny Fisk III, spread out a series of hand-drawn maps that revealed something extraordinary - rural Texas wasn't resource-poor, as conventional wisdom suggested, but material-rich beyond imagination. The maps showed volcanic ash perfect for lightweight concrete, caliche deposits stretching across vast territories, and mesquite forests that could supply both hardwood flooring and insulation. The revelation redefined prevailing notions of value in architecture.

Mapping as Design: A Resource-Based Approach to Rural Design in the United States - Image 1 of 4Mapping as Design: A Resource-Based Approach to Rural Design in the United States - Image 2 of 4Mapping as Design: A Resource-Based Approach to Rural Design in the United States - Image 3 of 4Mapping as Design: A Resource-Based Approach to Rural Design in the United States - Image 4 of 4Mapping as Design: A Resource-Based Approach to Rural Design in the United States - More Images+ 1

A Brief History of Maps and Their Role in Urban Development

Subscriber Access | 

Cartography, or map making, has played a critical role in representing spatial concepts for thousands of years. While the earliest forms of maps displayed geographic information carved into clay tablets and etched onto cave walls, the maps we use today have significantly evolved to creatively show a range of different information. These visualizations draw conclusions about population sizes, historical events, cultural shifts, and weather patterns to help us understand more about our world and how we impact it.

Sensory Maps: What the Sense of Smell Can Reveal about Urban Environments

Every city is a complex environment, bringing together people, cultures, architecture, commerce, and even nature. While experiencing a city, a lot of attention is given to its appearance, but appearance is not everything. The theory of sensory design aims to go beyond vision and explore the richness of the built environment through textures, smells, and sounds. For city officials and planners, a lot of attention generally goes towards how a city looks and sounds, but in terms of smell, the focus is mainly on managing waste or cleaning unsanitary areas. Yet the sense of smell, so often overlooked, is strongly linked to the creation of emotional memories. It contributes to our understanding of the world; it reveals otherwise hidden cultural practices, and it rounds up the experience of an environment.

Sensory Maps: What the Sense of Smell Can Reveal about Urban Environments - Image 1 of 4Sensory Maps: What the Sense of Smell Can Reveal about Urban Environments - Image 2 of 4Sensory Maps: What the Sense of Smell Can Reveal about Urban Environments - Image 3 of 4Sensory Maps: What the Sense of Smell Can Reveal about Urban Environments - Image 4 of 4Sensory Maps: What the Sense of Smell Can Reveal about Urban Environments - More Images+ 6

Invisible Landscapes: When Digital Tools Fail to Document

An online search away from any computer are eye-level views of many of the world’s cities. This technology is powerful – allowing people to have an in-depth look at the cities they might one day visit, live in, or work in. It’s a useful tool for understanding buildings on a more comprehensive level than photographs. This technology is, of course, Google Street View – which recently turned fifteen years old.

Invisible Landscapes: When Digital Tools Fail to Document  - Image 1 of 4Invisible Landscapes: When Digital Tools Fail to Document  - Image 2 of 4Invisible Landscapes: When Digital Tools Fail to Document  - Image 3 of 4Invisible Landscapes: When Digital Tools Fail to Document  - Image 4 of 4Invisible Landscapes: When Digital Tools Fail to Document  - More Images+ 5

Eyal Weizman on Forensic Architecture: ''Mapping is Power''

“Since I remember myself, I have wanted to be an architect… I could see the way that neighborhoods were organized. I could see the separation. I could see the frontier areas between the Palestinian community and the Jewish majority,” expresses Eyal Weizman in conversation with Louisiana Channel, in regards to understanding the ‘political significance’ of architecture and the potential of the occupation as a critical tool for understanding the world.

Eyal Weizman was interviewed by Marc-Christoph Wagner at Forensic Architecture’s studio in London, in April 2022. As the head of Forensic Architecture, he is renowned for his part within the multidisciplinary research group, using a combination of architectural technologies and techniques to investigate instances of state violence and violations of human rights across the globe. Growing up in Haifa, Israel he developed an understanding of the political connotations within architecture from an early stage.

Eyal Weizman on Forensic Architecture: ''Mapping is Power'' - Image 1 of 4Eyal Weizman on Forensic Architecture: ''Mapping is Power'' - Image 2 of 4Eyal Weizman on Forensic Architecture: ''Mapping is Power'' - Image 3 of 4Eyal Weizman on Forensic Architecture: ''Mapping is Power'' - Image 4 of 4Eyal Weizman on Forensic Architecture: ''Mapping is Power'' - More Images

Mapping Improvisation: The Role of Call and Response in Urban Planning

Mapping Improvisation: The Role of Call and Response in Urban Planning - Featured Image
Congo Square, E.W. Kemble. Image

This article was originally published on Common Edge.

New Orleans was designed by its early settlers in 1721 as a Cartesian grid. You know it as the famous French Quarter or Vieux Carré. Such grids are named for the Cartesian coordinate system we learned to use in algebra or geometry class, perpendicular X and Y axes, used to measure units of distance on a plane. The invention of René Descartes (1596–1650), these grids reflect his rationalism, the view that reason, not embodied or empirical experience, is the only source and certain test of knowledge. William Penn used a similar grid in 1682 in selling Philadelphia as an urban paradise where industry would thrive in the newly settled wilderness. And just as the massive buildings of Italian Rationalist (i.e., Fascist) architecture express authoritarian control, so, too, Cartesian grids implicitly say: Someone is in charge here. We’ve got this. Trust us.

Mapping the City of the 21st Century: Desplans and KooZA/rch Open up the Discourse to Young Creatives

Desplans and KooZA/rch have revealed the three final winners of the #mycityscape competition. Inviting young creatives to this conversation, the open call questions the definition of the city, by asking “What establishes the identity of a city? What distinguishes one urban environment from the other? And What defines our relationship to the built landscape we inhabit?

Trying to find the tools to map the city of the 21st century, the competition encouraged young creatives to record the essence of their cityscape into one image. After selecting 12 shortlisted entries, the contest solicited a wider audience to decide the final winning designs, by voting for their favorites on social media. Following the release of the results, Christele Harrouk from ArchDaily had the chance to talk about the #mycityscape competition with both Desplans and KooZA/rch, discussing the theme and the whole process. Discover in this article the exchange as well as the final winning designs.

Matt Daniels Maps World Populations as Mountains

Engineer Matt Daniels has created a new interactive map to visualize the world's populations. Called 'Human Terrain', the project includes extruded block-by-block population data for cities across the world to give viewers fine-grain insight into population distribution. Daniels used data from the Global Human Settlement Layer and processed it using Google Earth Engine to create a mountainous digital landscape.

BDA Prize 2019: INVISIBLE C'VILLE

The BDA Prize, an annual design and ideas competition, exists to generate forward-looking ideas to better our community through design and dialogue.

This Online Tool Generates High-Quality Geographic Maps of Data in Seconds

Subscriber Access | 

Have you ever had to create a map for your project, thinking you could get it done within 30 minutes, but then spent an entire afternoon on it? Between collecting data, creating a base map, choosing a color scheme, and finally putting together a graphic, creating a map can be a long, trying process, taking up precious time when you could be doing other work. Map-making shouldn’t be this way.

Created by Darkhorse Analytics, mapinseconds.com is a free online productivity tool which generates clear, quality maps based off of your data. Here’s how it works: collect and organize your data into two columns on either an Excel or Google spreadsheet, open mapinseconds.com, paste your data into the application’s spreadsheet, and voila! Your custom map is finished!

Citymapper, World-Renowned Urban Mobility App, Launches London's First Pop-Up Bus Route

Citymapper, World-Renowned Urban Mobility App, Launches London's First Pop-Up Bus Route - Image 4 of 4
Citymapper's new buses in central London. Image Courtesy of Citymapper

Citymapper, which is just over five years old, has become the go-to mobility app for the majority of the world's major cities. It's strength lies in its accuracy and integration: the app parses local data and always seems to deliver the fastest route, even in comparison to its leviathan, data-rich competitors – Google Maps and Apple Maps. Having always focused their attention on public transport, as opposed to cars and taxis, Citymapper has become embedded into the way large amounts of urbanites navigate cities both familiar and foreign. As of today, they are building buses—and bus routes—of their own.

Citymapper, World-Renowned Urban Mobility App, Launches London's First Pop-Up Bus Route - Featured ImageCitymapper, World-Renowned Urban Mobility App, Launches London's First Pop-Up Bus Route - Image 1 of 4Citymapper, World-Renowned Urban Mobility App, Launches London's First Pop-Up Bus Route - Image 2 of 4Citymapper, World-Renowned Urban Mobility App, Launches London's First Pop-Up Bus Route - Image 3 of 4Citymapper, World-Renowned Urban Mobility App, Launches London's First Pop-Up Bus Route - More Images+ 3

Cut Maps Adds Contemporary Precision to Cartographic Objects

Have you ever wanted to decorate your walls with old-style maps but been discouraged because they don't fit your minimal and contemporary aesthetic? Enter Cut Maps, the Virginia-based company that creates cartographic representations of cities and states using laser technologies to precisely define borders and streets. The resultant maps offer the illusion of their paper precedents, but with an otherworldly precision only possible in the digital age.

How Infrastructure Segregates Cities

The Washington Post has published a piece looking at how infrastructure acts as a form of segregation in cities in the US. Using racial dot maps from the University of Virginia’s Weldon Cooper Center for Public Service, they show how highways, railroads, historically uncrossable avenues, and similar urban design decisions have a huge impact on the physical isolation of different races. These types of infrastructure were also found to reinforce boundaries set by natural patterns of topography and bodies of water. Cities found to have clear infrastructural segregation include Pittsburgh, Hartford, Detroit, Washington, D.C., and Milwaukee. Read the full article, here.